

Anti-IL1 beta Antibody, Rabbit, Polyclonal
Catalog Number:
BOB-A00101-3
- Images (9)

| Article Name: | Anti-IL1 beta Antibody, Rabbit, Polyclonal |
| Biozol Catalog Number: | BOB-A00101-3 |
| Supplier Catalog Number: | A00101-3 |
| Alternative Catalog Number: | BOB-A00101-3-100UG |
| Manufacturer: | Boster Bio |
| Host: | Rabbit |
| Category: | Antikörper |
| Application: | ELISA, FC, IF, IHC, IP, WB |
| Species Reactivity: | Mouse |
| Immunogen: | This antibody was prepared by repeated immunizations with recombinant mouse IL-1ß produced in E.coli. The MW of recombinant mouse IL-1ß was 17 kDa. |
| Alternative Names: | IL-1 beta, IL-1b, Interleukin-1 beta, IL-1ß, catabolin |
| Boster Bio Anti-IL1 beta Antibody (Catalog A00101-3). Tested in IF, IHC, WB applications. This antibody reacts with Mouse. |
| Clonality: | Polyclonal |
| Concentration: | 1.0 mg/mL by UV absorbance at 280 nm |
| UniProt: | P10749 |
| Buffer: | 0.02 M Potassium Phosphate, 0.15 M Sodium Chloride, pH 7.2 |
| Form: | Lyophilized |
| Application Dilute: | ELISA: 1:1,000 - 1:5,000Flow Cytometry: User optimizedIHC: 1:50-1:250IF Microscopy: 1:50-1:250IP: 1:200-1:800WB: 1:500 - 1:2,000Neutralization: User optimizedAnti-Mouse IL-1ß has been tested for use in immunohistochemistry, immunoblotting and immunofluore |
|
|
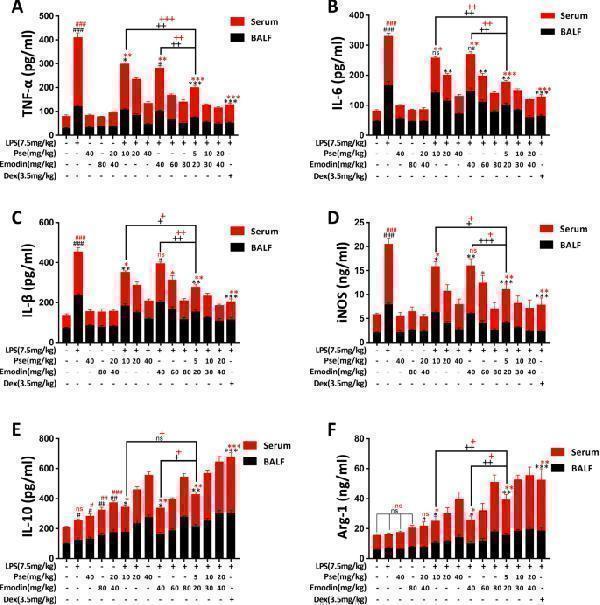
Effects of Pseudoephedrine+emodin on the expression of TNF-alpha, IL-6, IL-1beta, iNOS, IL-10, Arg-1 in LPS-induced ALI rats. The contents of TNF-alpha ( A ), IL-6 ( B ), IL-1beta ( C ), iNOS ( D ), IL-10 ( E ), Arg-1 ( F ) in the serum and BALF were determined using ELISA. Data were expressed as meanS.D. (n=3). p<0.05, p<0.01, p<0.001 vs. control group. *p<0.05, **p<0.01, ***p<0.001 vs. LPS alone group. + p<0.05, ++ p<0.01, +++ p<0.001 vs. combined treatment group (5+20mg/kg) Index in PubMed under a CC BY license. PMID: 35123524 |
|
|
|
|
|
|
|
|
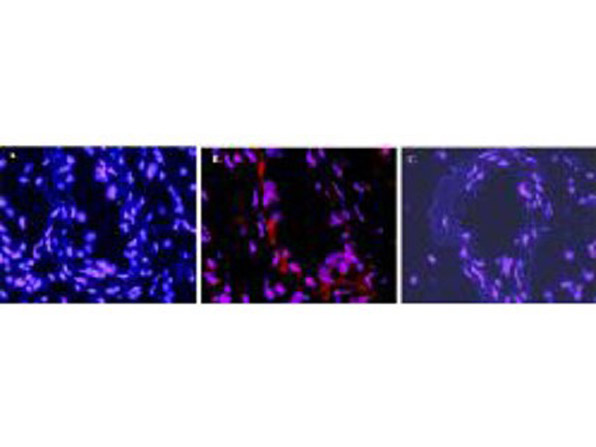
Immunofluorescence microscopy after staining of mouse carotid artery tissue with anti-Mouse IL-1ß antiserum diluted 1:50. Tissue sections were prepared after cryofixation. Reaction occurred at room temperature for 60 followed by washes and reaction with Rhodamine conjugated Gt-a-Rabbit IgG . Tissue was counterstained with bis-benzimide solution at 0.5 mg/ml in PBS for 15 min at room temperature. Panel A) shows no antibody staining of WT uninjured mouse carotid tissue. Panel B) shows anti-IL-1ß staining of cells after surgical injury of tissue. Panel C) shows no antibody staining of injured carotid tissue from an IL-1ß KO mouse. |
|
|
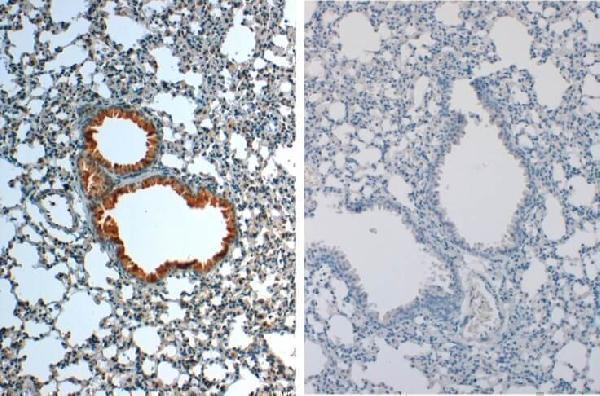
Immunohistochemistry of Rabbit anti-IL1Beta Antibody in Mouse Embryonic Kidney Tissue: Mouse Embryonic Kidney Fixation: FFPE buffered formalin 10% conc Ag Retrieval: Heat, Citrate pH 6.2. Pressure Cooker Primary antibody: 2ug/ml 1.5 hour room T Secondary Ab: MACH 1 HRP POLYMER 1:50 45 RT |
|
|
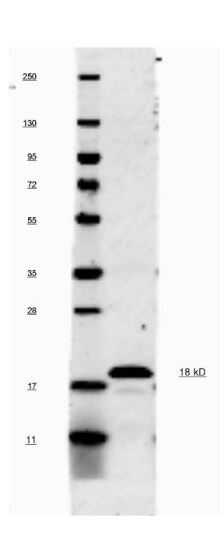
This antibody will recognize 10% of the non-denatured (native) precursor 31,000 MW mouse IL-1ß containing samples but will primarily detect all of the 17,000 MW mature molecule. However, in western blot analysis, the usual procedure of heating the sample in SDS with or without reducing agents will facilitate denaturing of the 31,000 MW IL- 1ß precursor molecule. Denatured IL-1ß will have a 18 kDa band. |
|
|
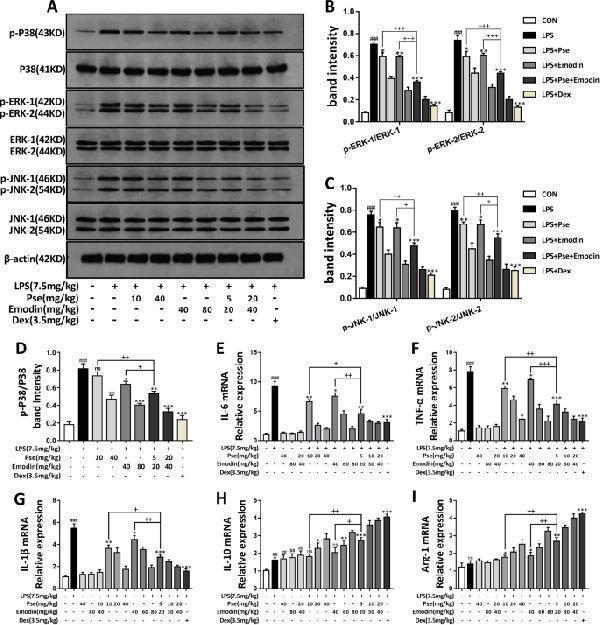
Pseudoephedrine+emodin Inhibited MAPK in LPS-induced acute lung injury in rats. A - D Western blot analysis was performed to detect p-P38, p-ERK1/2 and p-JNK1/2 protein expression. E - I TNF-alpha, IL-6, IL-1beta, IL-10, Arg-1 mRNA expression was determined using Real-time PCR analysis. All data are expressed as meanS.D. (n=3). p<0.01, p<0.001 vs. control group. *p<0.05, **p<0.01, ***p<0.001 vs. LPS alone group. + p<0.05, ++ p<0.01, +++ p<0.001 vs. Combined treatment group (5+20mg/kg) Index in PubMed under a CC BY license. PMID: 35123524 |
|
|
The main framework to construct the gene pathways dependency network. ( A ) Steps in identifying the genes regulated by ALA-PDT. ( B ) The 46 regulators most highly ranked based on their p-value in the microarray are depicted. ( C ) The KEGG database were used to analyze pathways associated with the inflammatory after ALA-PDT. 133 pathways at 3 hrs(red cycle) after PDT and 140 pathways at 6 hrs (green cycle) identified. Then built the pathway interaction based on the KEGG database on the website and identified the eight signaling pathways ( ). ( D ) Gene expression fold changes of two target genes IL1R1 and IL1beta as determined by microarray and real-time q-PCR experiments. The direction and magnitude of fold changes obtained from the real-time q-PCR technique were comparable to those obtained from the microarray technique. P < 0.05 for gene expression fold changes quantified by real-time PCR experiments as determined by two-tailed unpaired Students t -test. ( E - G ) IL1beta expression was increased 3hrs after ALA-PDT especially in fibroblasts (Vimentin positive cells). Notes: Data were presented as mean SEM. *p<0.05, **p<0.01, ***p<0.001.Index in PubMed under a CC BY license. PMID: 31849516 |
|
|
( A, B ) Accelerated solid tumor growth i |
Product Guarantee and Expert Support
